The Metric Every Endurance Athlete Argues About
Ask ten cycling coaches which training metric matters most and you will likely get ten different answers. Functional Threshold Power (FTP) has dominated the conversation for two decades, thanks largely to its popularization by coach Joe Friel and its integration into every major training platform from Zwift to TrainingPeaks. But a growing body of exercise science research argues that Critical Power (CP) is not just a better metric, it is a fundamentally more accurate model of human performance. The debate matters because your training zones, your pacing strategy, and your race-day decisions all flow from whichever metric you use as your foundation. Getting it wrong means training in the wrong zones, overestimating what you can sustain, and arriving at the start line underprepared or overtrained.
What FTP Actually Measures
FTP is defined as the highest average power output an athlete can sustain for approximately 60 minutes. In practice, most athletes estimate it from a 20-minute maximal effort, discounting the result by 5% to approximate the 60-minute value. It is intuitive, easy to test, and well understood, which explains its widespread adoption. The physiological basis of FTP corresponds roughly to the maximal lactate steady state (MLSS): the highest intensity at which blood lactate production and clearance are in equilibrium. Train below FTP and you are in a recoverable aerobic zone. Exceed it and lactate accumulates, fatigue accelerates, and performance degrades. The problem is that FTP is a single-point estimate. It tells you nothing about how your power output changes over different time durations, how much “anaerobic reserve” you have above threshold, or how your fatigue characteristics differ from another athlete with an identical FTP.
The Critical Power Model: A More Complete Picture
Critical Power is not just a number, it is a two-parameter mathematical model of the power-duration relationship. The model describes how long an athlete can sustain any given power output, based on two variables: Critical Power (CP) itself, which represents a theoretically sustainable metabolic rate, and W’ (pronounced “W prime”), which represents a finite anaerobic energy reserve measured in joules. The power-duration curve predicted by the CP model fits observed human performance data remarkably well across durations from approximately 2 minutes to 30+ minutes. When you ride above CP, you deplete W’ at a rate proportional to how far above CP you are working. When you recover below CP, W’ reconstitutes, a dynamic that FTP simply cannot capture. Research published in the European Journal of Sport Science has consistently shown that CP provides a more accurate physiological anchor than FTP, with CP corresponding more precisely to MLSS and the threshold between heavy and severe exercise intensity domains. A 2019 study by Poole et al. in Medicine & Science in Sports & Exercise described CP as “the most important parameter in exercise physiology” for understanding fatigue and performance limits.
How the Two Metrics Compare in Practice
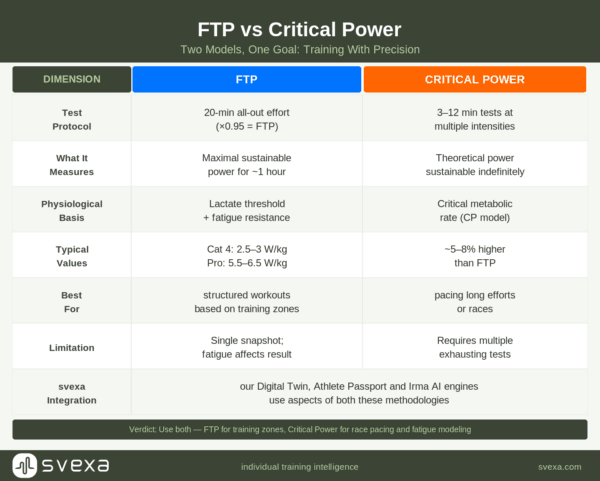
For most trained cyclists and triathletes, FTP and CP are numerically similar, typically within 5–10 watts of each other. But this apparent similarity masks important differences:
- Test protocol: FTP requires a single 20-minute maximal effort (or a full 60-minute test). CP requires multiple maximal efforts at different durations, typically 3–5 tests ranging from 3 minutes to 20 minutes. That provides a richer picture but demands more testing time.
- Anaerobic capacity: CP testing also yields W’, giving you a quantified anaerobic energy reserve. An athlete with a high W’ can surge repeatedly and recover; one with a low W’ must pace conservatively from the start.
- Pacing precision: CP-based pacing models can predict how long you can sustain any given power output above CP and exactly how much W’ you will have remaining at any point in a race.
- AI integration: Modern adaptive training platforms use the CP model as the foundation for personalized zone prescription and session targeting, updating the model dynamically as fitness evolves.
Which Should You Use?
The honest answer is: both have a role, and the best approach is to understand what each one tells you and when each is most useful. FTP remains the currency of most training platforms and race calculators. If you train exclusively on platforms that use FTP-based zones, working with CP data requires translation. For athletes who want to go deeper, particularly cyclists, triathletes, and runners preparing for events with variable pacing demands, CP and W’ provide a level of precision and strategic insight that FTP cannot match. The critical insight from exercise science is that fatigue is not a single-threshold phenomenon. Different athletes have different W’ values, different rates of W’ reconstitution, and different sensitivities to intensity. A training model that accounts for all of these variables is inherently more powerful than one built around a single power number. For a deeper understanding of the science, the International Society of Sports Nutrition position stand on training intensity distribution provides an excellent primer on intensity domains and their training applications
How Svexa Uses These Models
As always, svexa’s recommendation engine starts by incorporating all available data sources to make a hyper-personalized digital twin of the athlete. We also encourage the athlete to enter any known information, for example what they believe to be their maximum heart rate, FTP etc. As we gather more data over time, our AI integrates aspects of both FTP and Critical Power modeling into our unified profile, continually adapting our recommendations. In addition, svexa uses the data from all regular training sessions to calculate the performance metrics, i.e. no tests required. Rather than forcing athletes to choose between metrics, the platform contextualizes performance data within each athlete’s full physiological picture, including HRV trends, sleep quality, recovery status, and training load history, to generate training recommendations that are truly individualized. With all the data available, our performance platform suggests the optimal training program to meet the athlete’s goals.
Explore how svexa’s Irma recommendation engine uses real-time physiological data alongside power metrics to inform daily training decisions. As always, you can Contact Us to learn more about svexa products or discuss how we can help your customers.