More Data Does Not Mean Better Training
The modern fitness wearable is an extraordinary piece of technology. A device costing less than $400 now measures heart rate continuously, estimates HRV, tracks sleep stages, monitors blood oxygen saturation, counts steps, estimates caloric expenditure, and generates a daily “body battery” or “readiness score.” The result should be perfectly optimized training. Yet most athletes using wearables do not train more effectively – they just feel more anxious about their numbers. The problem is not the technology. It is the absence of a framework for deciding which metrics matter, which are reliable enough to act on, and which are sophisticated-looking noise.
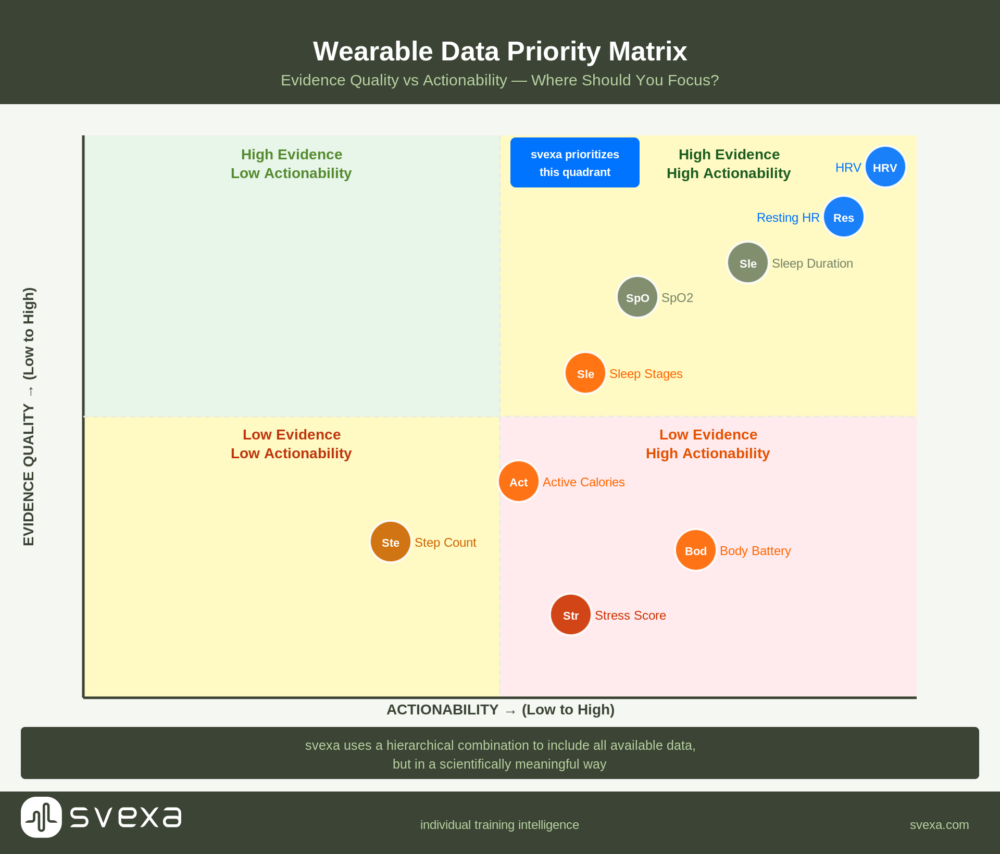
Tier 1: High Evidence, High Actionability
These are the metrics with strong scientific validation and clear training applications:
- HRV (Heart Rate Variability): The most scientifically validated wearable metric for training readiness. Used correctly (morning measurement, trend analysis, individual baseline comparison), it is reliably predictive of training adaptation quality. Chest strap measurement is most accurate; modern smartwatches provide adequate trend data.
- Resting Heart Rate: Simple, reliable, and highly sensitive to overreaching. An elevated resting HR of 5–7+ bpm above your rolling baseline is a consistent indicator of incomplete recovery or emerging illness. Most wearables measure this reliably.
- Sleep Duration: Total sleep time is strongly associated with next-day performance, injury risk, and immune function. Wearable sleep duration estimates are reasonably accurate (within 15–20 minutes for most devices). The target for most serious athletes is 8–9 hours… but of course that’s hard for most of us so do the best you can!
Tier 2: Moderate Evidence, Use with Caution
These metrics provide useful information when interpreted carefully, but should not drive training decisions in isolation:
- Sleep stage data (REM, deep sleep): Consumer wearable sleep stage classification has approximately 60–70% agreement with gold-standard polysomnography. It is meaningful as a trend indicator but individual night data should not be over-interpreted. Consistent low deep sleep proportions across multiple nights are more meaningful than a single poor reading.
- Blood oxygen saturation (SpO2): Useful for monitoring altitude acclimatization and flagging potential sleep apnea (consistent nocturnal SpO2 drops below 90%). For normal training at sea level, SpO2 rarely drops to actionable levels and should not drive daily decisions.
- Respiratory rate: Elevated resting respiratory rate can indicate illness, high cardiovascular fatigue, or altitude exposure. The metric is less validated than HRV for training guidance but worth monitoring for unusual deviations.
Tier 3: Low Evidence, Largely Ignore for Training Decisions
These metrics are heavily marketed but poorly validated for athletic applications:
- Calorie estimates: Wearable energy expenditure estimates have mean errors of 20–30% compared to laboratory doubly-labeled water methods, with individual errors ranging from 10% to 90%. Do not use wearable calorie data for precision nutrition planning. Svexa has developed more scientifically robust nutrition recommendation algorithms, and is currently rolling them out as part of our Irma integrated engine.
- Proprietary “body battery” scores: These manufacturer-specific composite scores are algorithmically derived from the underlying metrics (HRV, sleep, activity) but their exact calculation is often opaque and untested against training outcomes. If you can see the underlying HRV and sleep data, those are more actionable than a derived proprietary score.
- Stress scores from heart rate: Physiological and psychological stress produce overlapping autonomic signatures. A high “stress” reading during a difficult work meeting may be behaviorally significant but does not indicate training fatigue in the same way a post-exercise HRV suppression does.
Building a Practical Monitoring Protocol
The evidence supports a simple daily protocol:
- Morning HRV reading: 2–5 minutes, same time every day, before getting up
- Check resting heart rate alongside HRV (most apps record this automatically)
- Review previous night’s sleep duration (quality trends over multiple nights)
- Record subjective wellness (fatigue, soreness, mood, motivation) on a simple 1–10 scale
- Let the integrated picture guide training intensity — not any single metric in isolation
Svexa’s Readiness Advisor provides a simple way to capture the daily subjective wellness and HRV values. Going deeper, it ties into our IRMA platform by integrating data from all major wearable platforms (Apple Watch, Garmin, Whoop, Oura, Polar etc) then maintaining longitudinal records from all sources, enabling the individual baseline comparison that makes each metric meaningful and planning actionable.