Why Blood Tells You What GPS Can’t
GPS systems, heart rate monitors, and wellness questionnaires provide a rich picture of an athlete’s external and subjective responses to training. But there is a dimension of athletic readiness that these tools simply cannot see: what is happening at the biochemical level inside the athlete. Blood biomarker monitoring, the regular analysis of specific markers in the blood or serum, provides a window into physiological processes that no wearable can currently replicate: iron status, hormonal balance, inflammatory load, immune function, and the state of muscle tissue. For performance staff without a biochemistry background, blood biomarkers can seem technical and inaccessible. This guide demystifies the most clinically useful markers for sport performance, explains what they mean in practical terms, and describes how they fit within a comprehensive athlete monitoring program.
Key Biomarkers for Athletic Performance: A Practical Overview
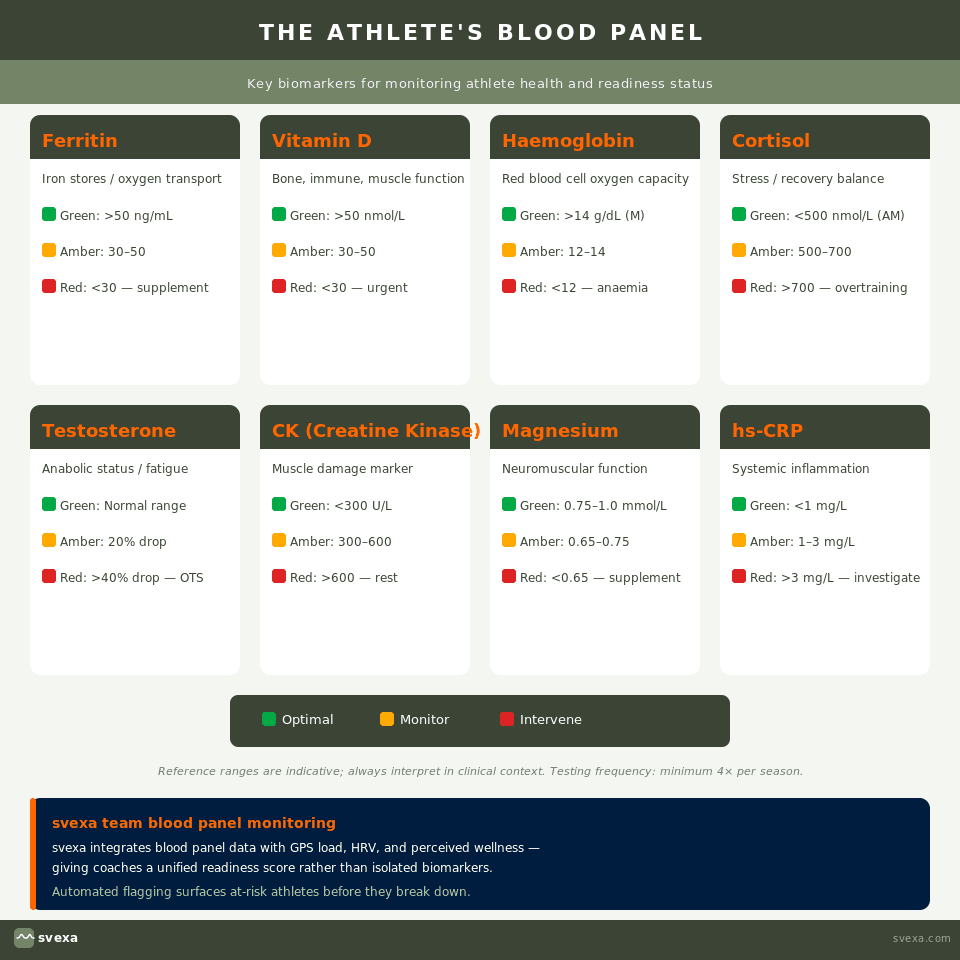
Ferritin — The Iron Store Marker
Iron deficiency is the most prevalent nutritional deficiency in athletes globally, affecting female athletes in particular. Ferritin, a protein that stores iron, is the most reliable single marker of iron status. Suboptimal ferritin levels (typically defined as below 30–35 ng/mL in athletes, though thresholds vary by sport and position) are associated with reduced oxygen-carrying capacity, impaired aerobic endurance, and increased fatigue perception. Many athletes experience significant performance decrements from iron deficiency well before hemoglobin falls to anaemic levels, making ferritin monitoring essential in female athletes and those in high-volume endurance training phases.
Creatine Kinase (CK) — The Muscle Damage Marker
CK is released into the bloodstream by damaged muscle cells, and elevated levels indicate acute muscle trauma from training or competition. In team sports, post-match CK typically peaks 24–48 hours after a match and returns to baseline within 72–96 hours. Individual CK responses vary enormously – some athletes routinely show very high post-match CK with no performance consequence, while others demonstrate marked fatigue at moderate elevations. Establishing individual baseline CK profiles is therefore essential before using CK as a readiness indicator.
Cortisol and the Testosterone:Cortisol Ratio
Cortisol is the primary stress hormone, elevated by both physical training load and psychological stress. In isolation, single cortisol measurements provide limited information. However, the testosterone:cortisol (T:C) ratio, reflecting the balance between anabolic and catabolic hormonal state, is one of the most sensitive available indicators of overreaching and accumulated training stress. A sustained decline in the T:C ratio below 60% of an athlete’s individual baseline has been associated with non-functional overreaching in published research.
C-Reactive Protein (CRP) and Inflammatory Markers
CRP is an acute-phase protein produced in response to systemic inflammation. Chronically elevated CRP in an athlete, in the absence of acute illness or injury, may indicate chronic overtraining, persistent soft tissue microtrauma, or subclinical infection. Combined with other readiness indicators, CRP trend data contributes to a more complete picture of physiological recovery status.
Vitamin D
Vitamin D deficiency is extremely prevalent in athletes playing in northern latitudes, particularly in winter months or indoor sports. Suboptimal vitamin D status is associated with elevated injury risk (particularly stress fractures and muscle injuries), reduced immune function, and impaired neuromuscular performance. The
American College of Sports Medicine recommends maintaining serum 25-hydroxyvitamin D above 40–60 ng/mL for optimal athletic health.
How to Integrate Biomarkers with Your Monitoring Program
Blood biomarkers are most valuable not as isolated data points but as part of a longitudinal monitoring program that contextualizes individual values against each athlete’s own baseline history. A single cortisol measurement means very little; a sustained trend in the cortisol:testosterone ratio over eight weeks, combined with declining GPS performance metrics and worsening wellness scores, builds a compelling picture of cumulative training stress.
- Establish individual baselines during pre-season healthy states – these are the reference values against which future readings are interpreted
- Test at regular intervals (monthly in-season as a minimum) to capture trends rather than isolated values
- Contextualize all biomarker results with concurrent training load data. Elevated CK after a particularly heavy training week is expected, but the same elevation after a light week is more concerning
- Use biomarkers to validate or challenge what other monitoring tools are telling you – concordance increases diagnostic confidence
Svexa’s Digital Twin incorporates any available biomarker data alongside regular longitudinal training load and performance metrics from wearables, to enable a multi-dimensional trend analysis and deliver a complete physiological profile. This is the foundation for maximum personalization in our recommendation engines like Irma, and other algorithms. Contact svexa to discuss how biomarker monitoring integrates with your performance program.