

Same sensors. Far better answers.
Most wearable algorithms apply one formula to everyone. Svexa’s individualized models run on the same class of sensor data, and in several cases the identical data, and consistently deliver higher algorithm accuracy for the individual. Here’s the evidence.
R² 0.89 vs 0.13
individualized recovery rating vs a leading
wearable’s readiness score, same inputs
wearable’s readiness score, same inputs
~6.2%
median energy-expenditure error
vs ~20–30% for commercial wearables
vs ~20–30% for commercial wearables
>15×
more accurate injury-risk load
metric than GPS-based load
metric than GPS-based load
0.3%
mean race-time error
for elite swimmers
for elite swimmers
Why population formulas fail the individual
Conventional wearable algorithms are typically calibrated at population level: one formula or coefficient set for everyone, with limited personal calibration such as resting heart rate or age-predicted maximum. That works reasonably well on average, but it is often wrong for any specific person, because responses to training, recovery and load vary substantially between people whose raw sensor data looks the same.
Svexa’s founders have studied this gap for years. A Stanford study they co-authored tested seven leading wrist-worn devices against clinical gold standards and found that while most measured heart rate acceptably (median error under 5%), all failed significantly on energy expenditure, with errors above 20%.
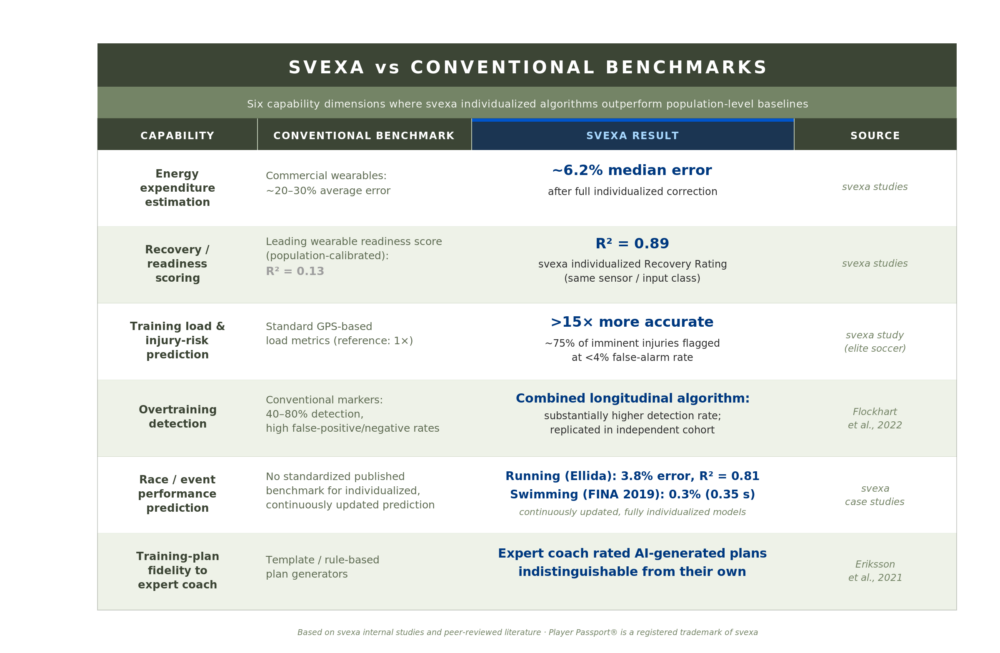
Svexa’s team builds algorithms based on the latest science, and continually runs studies to compare our real-world results with industry standards. We’re proud to stay at the leading edge, showing we can outperform typical benchmarks on many metrics.

Recovery and readiness: R² 0.89 vs 0.13
Using the same class of wearable inputs (resting heart rate, body temperature, sleep efficiency, total sleep and activity time), svexa’s individualized model explained far more of the variance in each person’s actual recovery status (R² = 0.89) than a leading commercial wearable’s population-calibrated readiness score derived from the same inputs (R² = 0.13), which was adequate mainly for flagging extreme cases.

Injury risk: individualized load vs GPS load
In elite soccer, an individualized training-load metric from svexa’s Athlete Passport® was more than 15× more accurate at predicting injury risk than widely used GPS-based load metrics, flagging around 75% of imminent injuries in previously injured players with under 4% false positives.
Overtraining: trends beat snapshots
Single markers caught only 40–80% of overtraining cases. Tracking several markers together over time substantially improved detection, and held up in an independent cohort.
How to read these numbers
We report accuracy honestly, including the conditions behind it. Svexa’s accuracy is not a single fixed percentage: it improves as more individual data becomes available, and the system widens its confidence when data is sparse. Results above come from specific cohorts and sports; we are happy to run a validation on your devices and your users.
FAQ
- How accurate are wearable calorie estimates?
Independent research co-authored by svexa’s founders found all seven tested wrist-worn devices exceeded 20% error on energy expenditure. Svexa’s individualized correction reduced median error to about 6.2%. - Are readiness scores accurate?
Population-calibrated readiness scores capture extremes but explain little of the day-to-day variation in an individual’s recovery (R² = 0.13 in our comparison). Svexa’s individualized rating, on the same inputs, reached R² = 0.89. - Can svexa validate on our hardware?
Yes. We regularly run joint validation studies to fine-tune svexa for a partner’s sensors and population.
Continue exploring svexa science
newsletter signup
Once in a while we send our subscribers a newsletter with corporate news, useful industry information or just a sneak peek of what we’re doing at svexa.